Data Layers
The NAVER Maps API v3 provides a virtual Data layer that expresses dots, lines, and shapes on a map, based on geospatial data. It allows you to express geospatial data in GeoJSON, KML, and GPX forms on the map, or store the data on the map in the GeoJSON form.
The geospatial data in
KMLorGPXform will be internally converted into the one inGeoJSONform. The following elements are supported.
GPX
- Line Paths (wpt, rte, trk)
- Line Styles (color, opacity, width, linecap, pattern)
- bounds, name, time, desc, cmt, type, sym
KML
- Point, LineString, LinearRing, Polygon, MultiGeometry, gx:Track, gx:MultiTrack
- Style (LineStyle, PolyStyle)
- LatLonAltBox
- name, address, description, visibility
Overview
The Data layer deals with features of the GeoJSON geospatial data. Each feature is expressed as a Feature object, and its geometry is expressed as a Geometry object. A Feature object is rendered as a polyline, a polygon or a marker, depending on its geometry type.
The geospatial data in KML or GPX form will be internally converted into the one in
GeoJSONform.
If the type of geometry is GeometryCollection, a geometry collection named geometryies exists where various types of geometry can exist. In other words, one Feature object can manage multiple types of Geometry objects. As the type of a Geometry object means one overlay, a Feature object can manage multiple types of overlays.
The following table defines overlay types used by the NAVER Maps API v3, depending on the geometry types of the GeoJSON geospatial data.
| Geomery type | Overlay type | Description |
|---|---|---|
| Point | Marker | One marker |
| MultiPoint | Marker | One or more markers |
| LineString | Polyline | One polyline |
| MultiLineString | Polyline | One or more polylines |
| Polygon | Polygon | One polygon |
| MultiPolygon | Polygon | One or more polygon |
The style and properties of a Feature can be changed and stored in GeoJSON form. For more information, refer to [GeoJSON specifications](http://geojson.org](http://geojson.org).
Load GeoJSON
Use the addGeoJson method to load GeoJSON data. By default, all Map objects contain data objects. This is why the map.data.addGeoJson method is used.
$.ajax({
    url: './geojson/naver.json',
    dataType: 'json',
    success: startDataLayer
});

var map;
function startDataLayer(geojson) {
    map = new naver.map.Map('map', {
        zoom: 13,
        center: new naver.maps.LatLng(37.3586524, 127.1060678)
    });

    map.data.addGeoJson(geojson);
}
This example contains jQuery code.
Style GeoJSON data
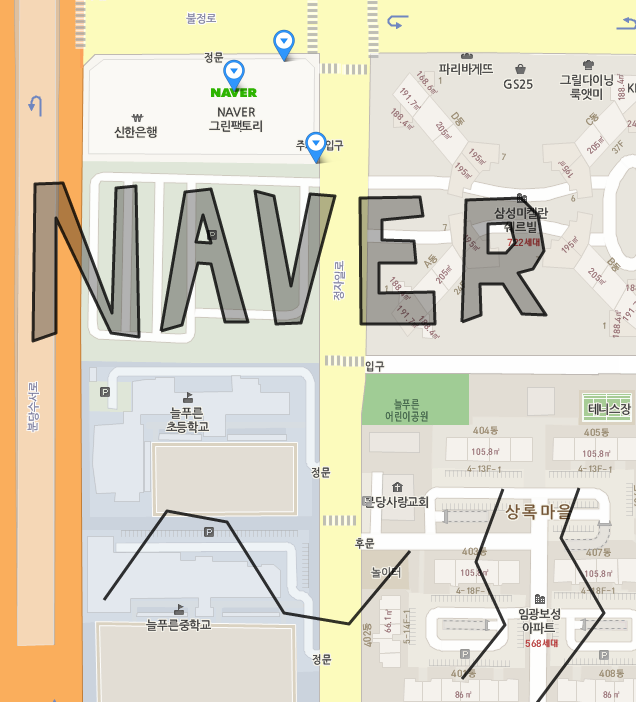
To style features of the GeoJSON geospatial data, use the setStyle method. This method affects all Feature objects of the data layer, and uses the StyleOptions object literal or the StylingFunction function as an argument.
Using the StyleOptions object literal
Styles specified by the StyleOptions object literal are applied to all Feature objects. However, the range of application differs depending on the geometry type of each Feature object. For example, the icon style only affects the geometry of Point and MultiPoint, which are the Marker overlay type.
map.data.setStyle({
    strokeColor: 'red',
    fillColor: 'red',
    icon: './img/pin_spot.png'
});
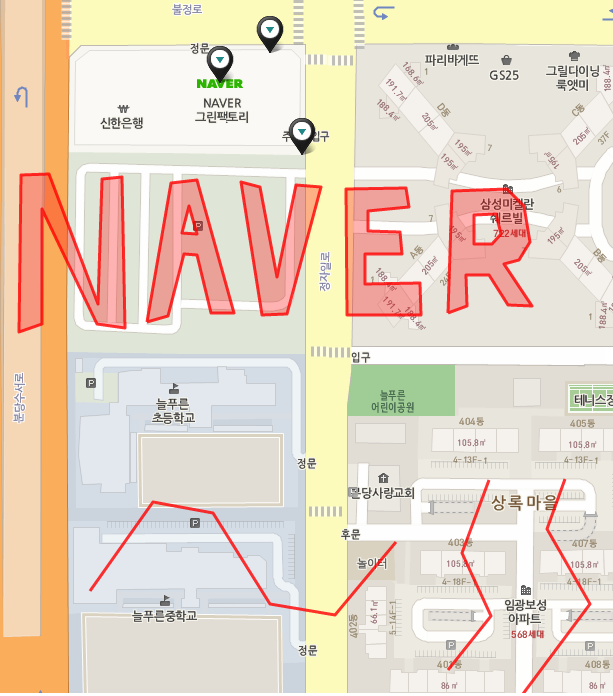
Using the StylingFunction function
Using the StylingFunction function, you can specify different styles depending on the properties or characteristics of each Feature object.
map.data.setStyle(function(feature) {
    var color = 'red';

    if (feature.getProperty('color')) {
        color = feature.getProperty('color');
    }

    return {
        strokeColor: color,
        fillColor: color
    };
});
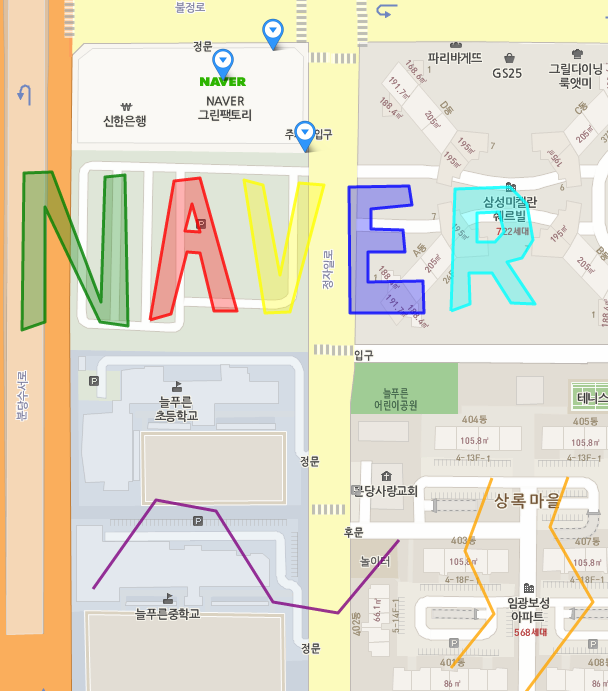
Re-define styles
As described above, the setStyle method affects all Feature objects of the Data layer, which is called a global style. To specify a style to a specific Feature object, use the overrideStyle method. This method overrides the global style.
To revert to the previous style, use the revertStyle method. This method can be used for a specific Feature object, but without arguments, it affects all Feature objects.
The following code example changes the style when a user’s mouse pointer enters into the geometry boundary, and makes it revert to the previous style when the mouse pointer gets out of the boundary.
map.data.addListener('mouseover', function(e) {
    map.data.overrideStyle(e.feature, {
        strokeWeight: 8,
        icon: './img/pin_spot.png'
    });

    map.data.addListener('mouseout', function(e) {
        map.data.revertStyle();
    });
Data layer events
The Data layer raises events when UI interactions or properties of each Feature object are changed or when a Feature object is added or deleted. For more information on events, refer to Events in Data layer.
The following code example changes styles of each Feature object when a user’s mouse pointer enters into or gets out of the geometry boundaries, reflects styles by using the properties of a Feature object when it is clicked, and moves the map by using the coordinate bounds of the Feature object when it is double-clicked.
var map = new naver.maps.Map(document.getElementById('map'), {
    zoom: 13,
    mapTypeId: 'normal',
    center: new naver.maps.LatLng(37.3586524, 127.1060678)
});

$.ajax({
    url: '../geojson/naver.json',
    dataType: 'json',
    success: startDataLayer
});

function startDataLayer(geojson) {
    map.data.addGeoJson(geojson);

    map.data.setStyle(function(feature) {
        var color = 'red';

        if (feature.getProperty('isColorful')) {
            color = feature.getProperty('color');
        }

        return {
            fillColor: color,
            strokeColor: color,
            strokeWeight: 2,
            icon: null
        };
    });

    map.data.addListener('click', function(e) {
        e.feature.setProperty('isColorful', true);
    });

    map.data.addListener('dblclick', function(e) {
        var bounds = e.feature.getBounds();

        if (bounds) {
            map.panToBounds(bounds);
        }
    });

    map.data.addListener('mouseover', function(e) {
        map.data.overrideStyle(e.feature, {
            strokeWeight: 8,
            icon: './img/pin_spot.png'
        });
    });

    map.data.addListener('mouseout', function(e) {
        map.data.revertStyle();
    });
}
This example contains jQuery code.
Examples: Displaying the GeoJSON data layer
Load KML
Use the addKml method to load KML data. By default, all Map objects contain data objects. This is why the map.data.addKml method is used.
$.ajax({
    url: './geojson/naver.kml',
    dataType: 'xml',
    success: startDataLayer
});

var map;
function startDataLayer(xmlDoc) {
    map = new naver.map.Map('map', {
        zoom: 13,
        center: new naver.maps.LatLng(37.3586524, 127.1060678)
    });

    map.data.addKml(xmlDoc);
}
This example contains jQuery code.
Examples: Displaying the KML data layer
Load GPX
Use the addGpx method to load GPX data. By default, all Map objects contain data objects. This is why the map.data.addGpx method is used.
$.ajax({
    url: './geojson/naver.gpx',
    dataType: 'xml',
    success: startDataLayer
});

var map;
function startDataLayer(xmlDoc) {
    map = new naver.map.Map('map', {
        zoom: 13,
        center: new naver.maps.LatLng(37.3586524, 127.1060678)
    });

    map.data.addGpx(xmlDoc);
}
This example contains jQuery code.
Examples: Displaying the GPX data layer